 |
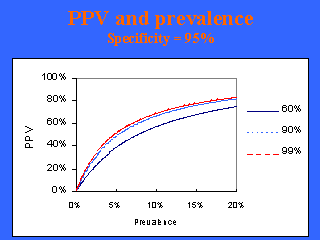
This chart illustrates an important relationship between
predictive value and disease prevalence. These calculations are done for a specificity of
95%. When a disease is relatively common, or has a high prevalence, a test is fairly
accurate in identifying those that have disease. For example, if a very sensitive test,
with a sensitivity of 99%, is used in a population where the disease prevalence is 20%,
then 83% of the people in whom it is positive will have the disease. A test with a
sensitivity of 60% will have a predictive value of 75% in the same population. In other
words, 1 in four people who test positive will not have the disease.
One-quarter of the people will be false positive.
Note that as the disease prevalence drops, the predictive value falls very quickly, even
for a very sensitive test. When the disease prevalence is 1%, than the predictive value
drops to 16.7%, with a very sensitive screening test of 99%. In other words, 1 in 6 people
who test positive will have disease. When the prevalence is 0.1%, which is not uncommon
when screening is applied to a healthy population, than the PPV is about 2%, 1 in 50
people who test positive will actually have the disease. The rest, 98%, will be false
positive. |
