|
|
|
|
front |1 |2 |3 |4 |5 |6 |7 |8 |9 |10 |11 |12 |13 |14 |15 |16 |17 |18 |19 |20 |21 |22 |23 |24 |25 |review |
 |
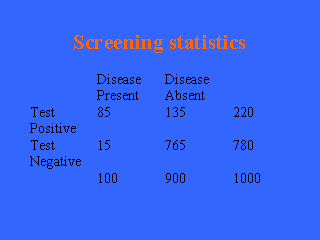
This slide illustrates what happens when a screening test with different
characteristics is applied to the same population. The sensitivity is
now 85% and the specificity is 85%. Many screening tests in common use
have similar characteristics. The positive predictive value is now 38.6% (85/220). Of 220 people that test positive, only 85 will truly have disease. The negative predictive value in this instance is 98.1% (765/780). Note that the positive predictive value is what determines how many people are referred on for diagnostic evaluation after screening. Both the test characteristics and the prevalence are related to this. |