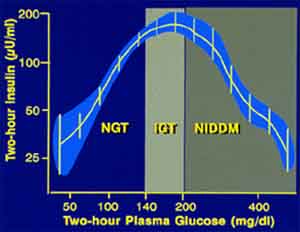
| Two-hour
insulin (mean+ 95% CI) and plasma glucose concentrations in
Pima Indians |
 |
|
Indications that insulin resistance may be the earliest identifiable phase
in the development of Type 2 diabetes came from cross-sectional studies
which examined mean insulin levels in relation to various degrees of
glucose tolerance. This graph shows an inverted U shape curve, which was
first described by Professor Reaven in 1969. This relationship has since
been described in many different populations. Insulin levels, on average,
are higher in persons with IGT than in those with normal glucose tolerance
(NGT) or with diabetes. In Type 2 diabetes, insulin levels fall
consistently as glucose concentration increases. Conversely , within the
range of NGT, insulin levels increase with increasing glycaemia. From
cross-sectional data one cannot infer that individuals progressing from
NGT to diabetes will necessarily follow the inverted U shape curve.
Prospective studies are needed to address this issue. |