| front |1 |2 |3 |4 |5 |6 |7 |8 |9 |10 |11 |12 |13 |14 |15 |16 |17 |18 |19 |20 |21 |22 |23 |review |
 |
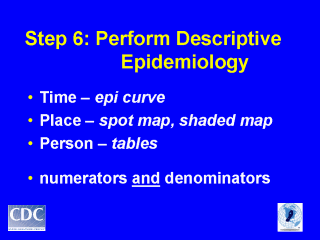
Time – begin with describing when people became ill. Usually displayed graphically with epidemic curve (“epi curve” for short) – histogram (not bar chart) with time on X axis, # cases on Y axis Place – where do the case-patients live or work? Person – who are they? All ages, both sexes, or restricted to just some groups? |