Search for most updated materials ↑
 |
 |
front |1 |2 |3 |4 |5 |6 |7 |8 |9 |10 |11 |12 |13 |14 |15 |16 |17 |review |
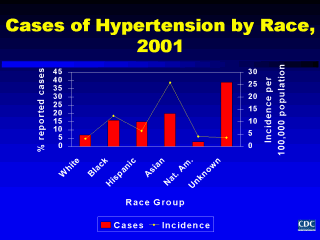 Another way we can summarize surveillance data is by the race of individuals. Our example looks at the chronic disease of hypertension. Of the 307 cases of hypertension, the greatest percent of cases with known race occurred among Asians. When we calculated the incidence of disease (to take into account differences in racial distribution within our population), we still observed that Asians had the highest incidence for hypertension. This data summary led us to ask questions that required additional, special data analyses such as: Why was there a disproportionate burden of hypertension among Asians when compared with people of other race groups? Does this disproportionate disease burden suggest environmental and behavioral differences? Differences in provider disease reporting practices, access to medical care, diagnostic testing, or other factors? Also note that for nearly two-fifths of the cases reported to our surveillance system, race was unknown. This suggested incomplete case investigation efforts and thus, an area in which our surveillance system needed to be improved. As you can see, summaries of surveillance data tell us about disease burden, which in turn informs us about the need for additional information about cases and data analyses. In this situation, the next step would be to obtain information on race for the 39% of cases for whom this information was missing, recalculate the incidence of hypertension for each race group, then target the race group with the highest incidence for immediate intervention efforts. |
|
|
|
front |1 |2 |3 |4 |5 |6 |7 |8 |9 |10 |11 |12 |13 |14 |15 |16 |17 |review |